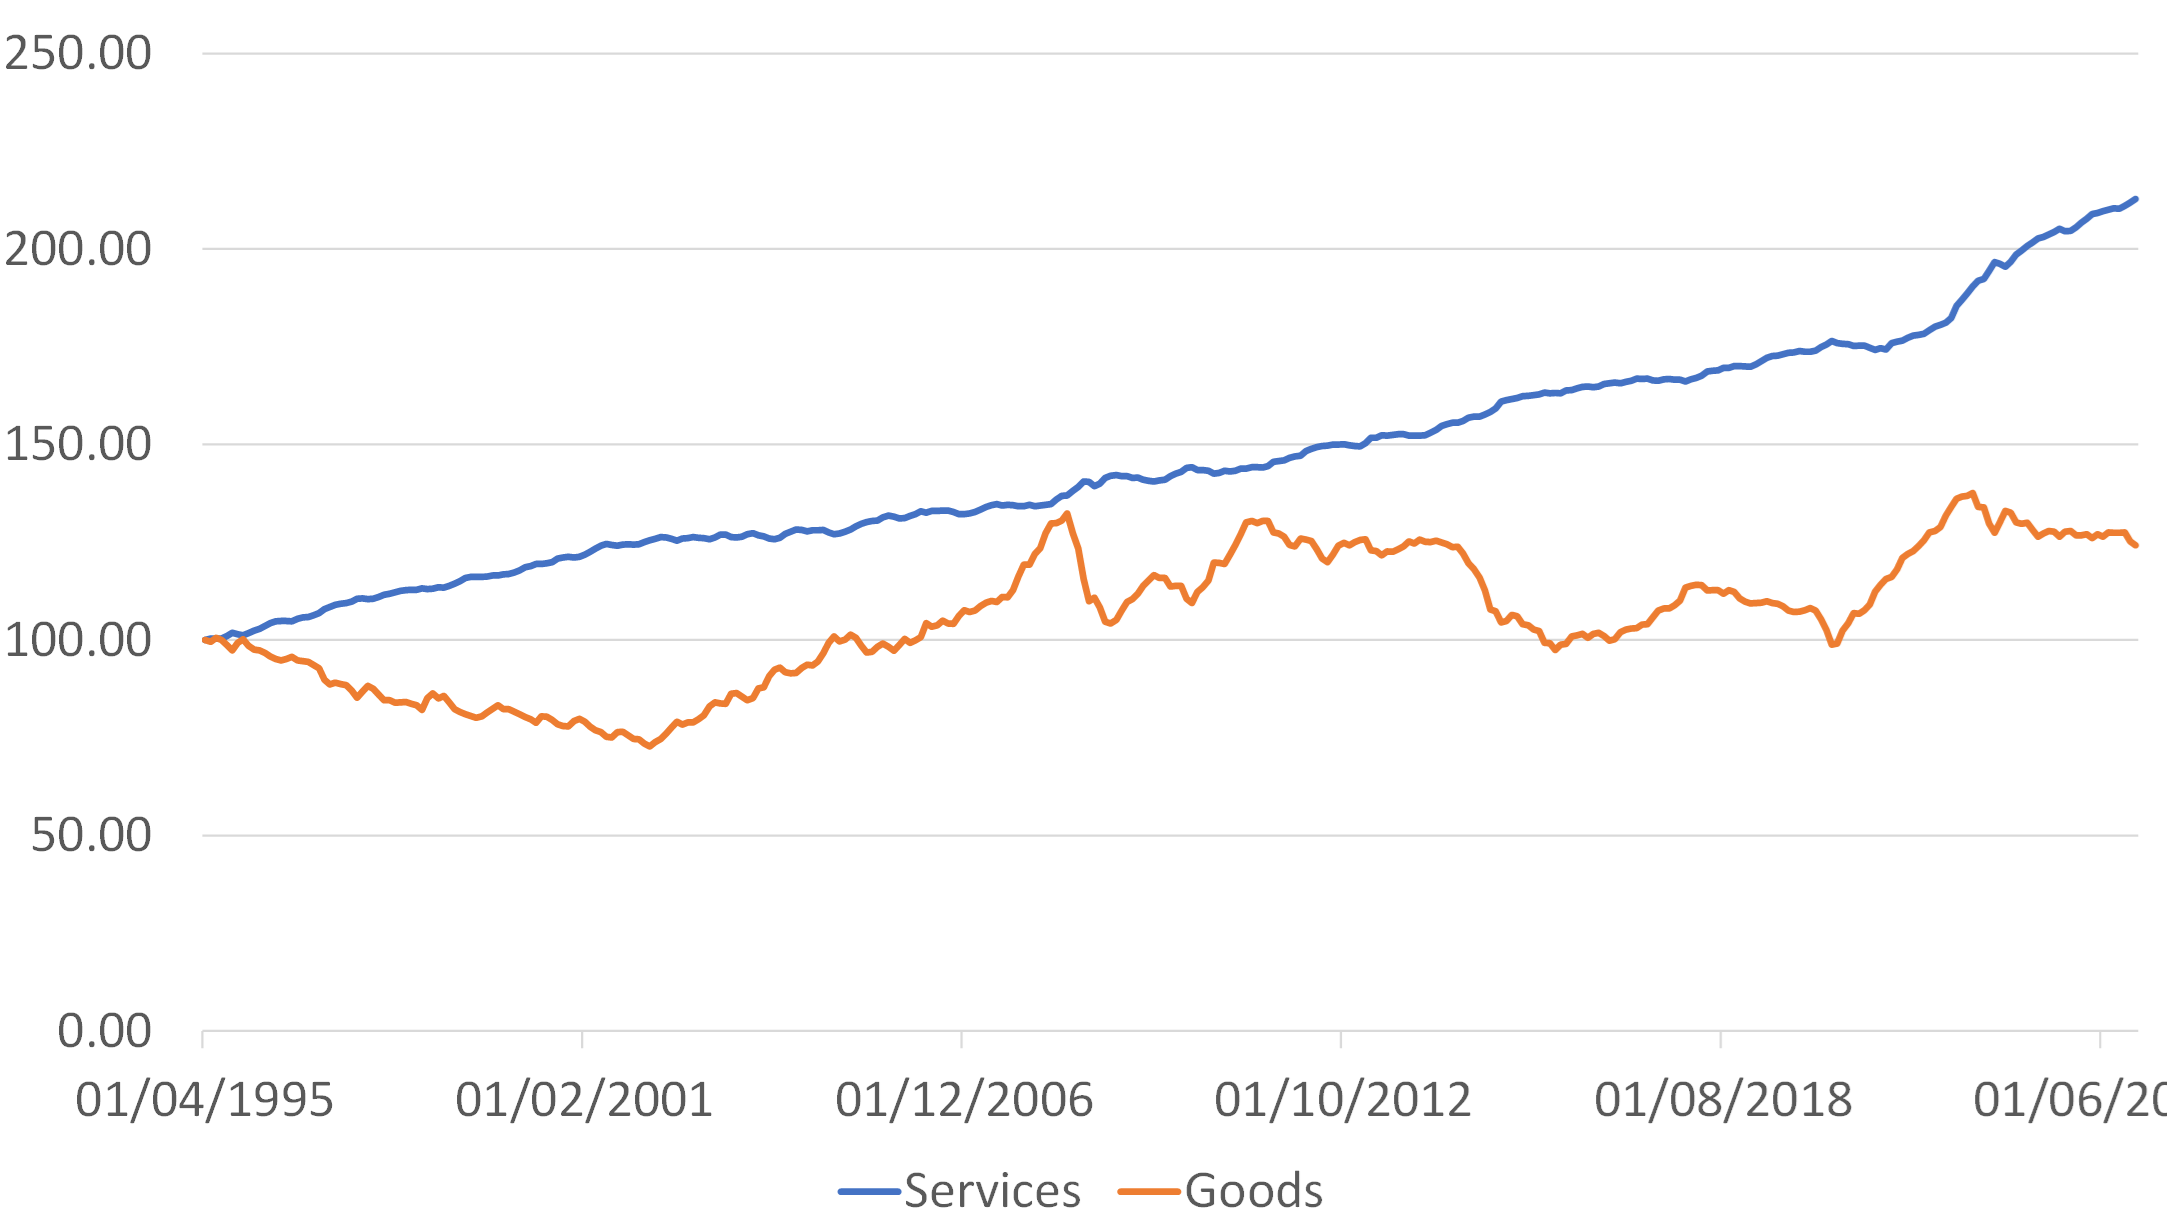
The chart below is by no means perfect in terms of its specific execution; global price indices are few and far between but it serves to make the point that, since the advent of “Globalization” during the early – mid 1990s, goods prices have lagged service sector prices by a considerable margin. Persistently positive demand versus output gaps in the West resulted in equally persistent rates of service sector and non-traded inflation, while North Asia’s output & employment maximizing pricing behaviour contained goods prices for structural reasons. This is why you can either buy a new TV set that lasts for years, or alternatively have dinner for two in an okay restaurant for virtually the same price.
Developed World Price Indices
1995 = 100

1995 = 100

Over time, it is true that non-traded goods prices should tend to rise relative to traded goods prices according to the productivity growth differential between the two sectors (trust me on this…), but since DM world productivity growth has been low for decades, this does not justify much of the “relative inflation” that has occurred in non-traded goods prices. Instead, we simply have a world in which service sector prices (which implicitly contain a lot of property prices – the cost of providing a service in any locale has a large property price component) are fundamentally overvalued relative to goods prices.
As a result of this out of kilter situation, we also have income and wealth inequality, low productivity growth, weak median real wage growth, and shrinking manufacturing sectors – or vanished manufacturing sectors – in much of the Western World. More than 200 years ago, the Classical Economists such as David Ricardo knew that this type of situation represented bad news, and it still does.
The best way to emerge from this mess would be faster productivity growth that justified the differential between the two types of goods. This nirvana-like outcome is easy to say but hard to do – and no one seems to be actively trying to achieve this route at present – a few governments are trusting to luck but that is about all. This golden scenario of a productivity miracle remains elusive.
As an alternative, an individual country can raise its goods prices internally simply by depreciating its currency, but currencies are ultimately a zero-sum game for the world as a whole – the best that you can hope for is a sequenced “race to the bottom” whereby countries take it in turns to have import price inflation that lifts their goods prices. Talk of a new Mar-a-Lago Currency Accord is simply the latest iteration of this idea, but to reiterate this type of event can only be a zero sum game unless other policies are enacted around the currency manipulation.
A better version of the simple devaluation merry-go-around would be to depreciate one’s currency and ease at the same time, in the hope that the resulting inflation would act disproportionately on goods prices. If “everyone” did this, then goods prices might well adjust upward relative to goods prices. This higher inflation outcome might not seem appealing, but it would work and the currency volatility would at least give analysts plenty to talk about…
Inasmuch as tariffs could also serve to raise goods prices, they do make a degree of sense in this distorted world, although they only do so by potentially raising headline inflation rates to the detriment of at least some of the population’s real incomes. We say potentially raise inflation here, since if the threat of tariff-generated inflation led to tighter monetary conditions, then non-traded goods prices might stagnate of even deflate and thereby mathematically offset the rise in goods price inflation in the headline indices. Tariffs could therefore “work” to close the gap between traded and non-traded goods prices; they are not an entirely mad idea in the way that some suggest that they are but there would still be casualties…
In all likelihood, the casualties from the tariff solution would certainly be less than if one adopted the “Mieno Solution” of simply tightening so much that non-traded goods prices deflate back towards goods prices. Unfortunately, the collateral damage that was inflicted on Japan’s economy by such a policy during the 1990s was so great that we doubt that few policymakers will willingly follow Mieno’s lead. This solution would we suspect only occur by accident.
It is therefore perhaps a scary thought that, absent the “productivity miracle”, the least painful options to resolve the overvaluation of service (and property) prices relative to goods prices (and wages) would be a series of competitive devaluations backed up by inflationary domestic monetary policies, and perhaps even the use tariffs. We might want to quibble about the implementation of policies, but the Trump Administration’s strategies are not quite as flawed as some suppose.
As we note above, currency adjustments on their own are, of course, primarily a relative and in effect zero sum game, which thereby raises the question of who will ultimately be the “winners” and “losers” if we are indeed entering some form of longer term adjustment process?
Over the very long term, currency cross rates may react to underlying competitiveness issues, physical trade imbalances, and even flows of genuinely productive foreign direct investment in factories and other facilities, but the days in which these variables might dictate short term or even medium term movements in exchange rates seem to long (generations) behind us. Today, capital flows are the primary determinants of currency moves, and their direction will depend to a large extent on the “regime” in which the world is operating at that time.
Between 1985 and 2024, the overriding regime was one of the encouragement of global capital flows. Governments responded to the prevailing academic mood – and we suspect a great deal of lobbying by the finance sector – by implementing wholesale financial deregulation. A number of (in theory) currency volatility reducing international accords were agreed, including the Plaza, Louvre and Shanghai initiatives that amongst other things were explicitly designed to encourage greater capital flows. Finally, the major economies were generally “run hot” with more often than not accommodative monetary regimes that help to facilitate and indeed fund every larger capital flows between nations.
The world of ever-expanding capital flows allowed many of the world’s larger economies – and at times many EM (although their experiences were more mixed) to run persistent current account or even twin current account and budget deficits without fear of funding constraints. The US, UK, France and NZ have generally been able to access the capital they required at seemingly reasonable prices so that they could operate with low private and or public sector savings. During the 1950s, 1960s and even 1970s, such spendthrift behaviour would normally have resulted in a balance of payments crisis and a traumatic currency “event”.
The Post 1985 world of ever-expanding international capital flows saw some countries become owners of substantial net foreign assets, while others – naturally – found themselves with net foreign liabilities. Our work on effective returns to savers suggests that in many ways it was the net liabilities countries that ultimately “did the best out of this system” – they got to borrow cheaply to fund consumption, their currencies were supported by inflows, as was investment and even the rapid financialization of their economies. Conversely, the returns to the “saver” countries were quite poor – they were not generally well rewarded for fiscal or even personal prudence.
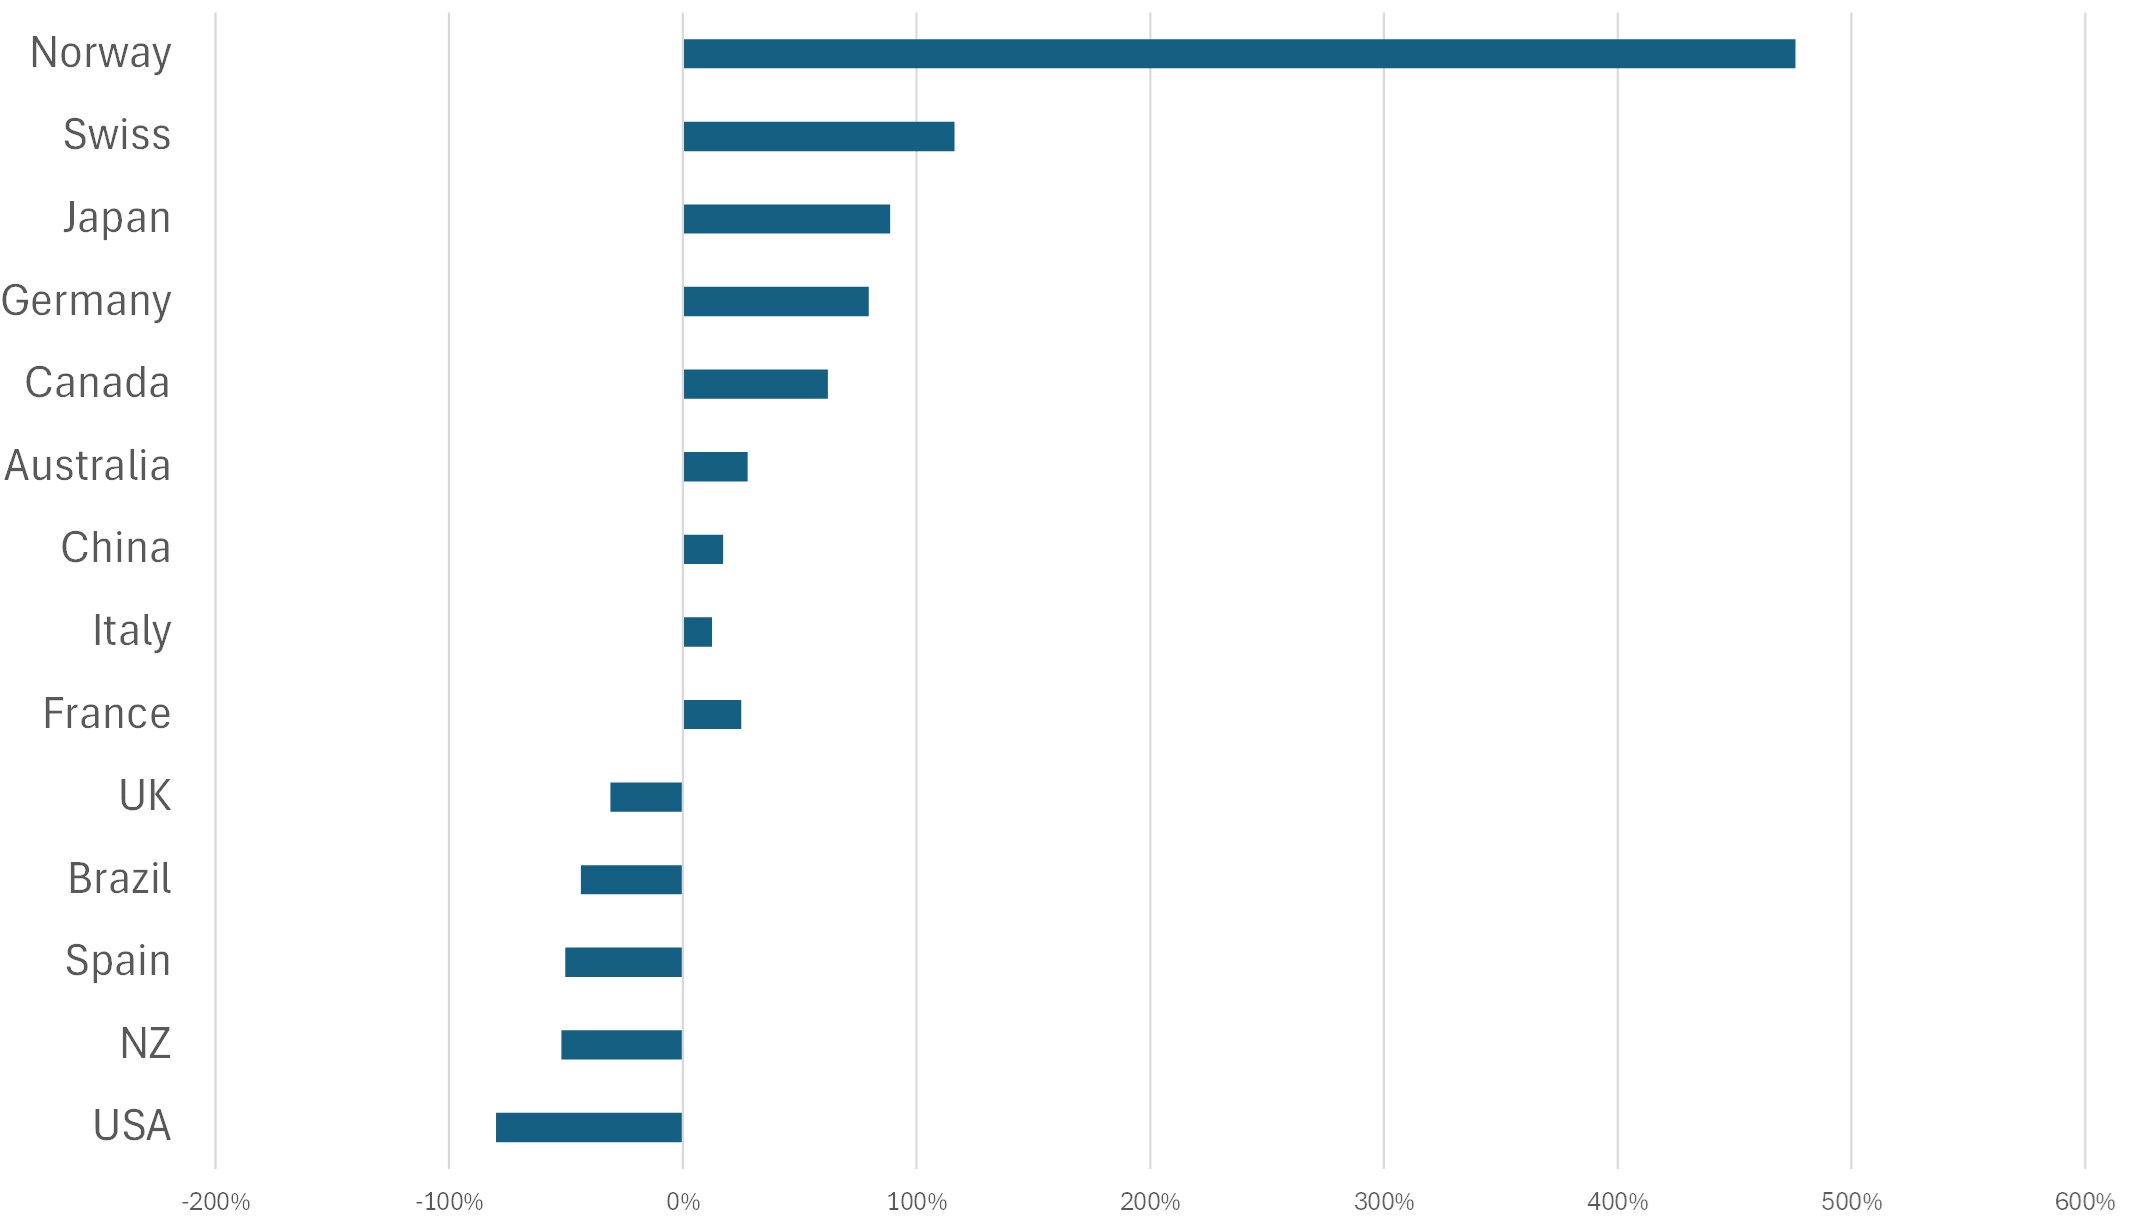
However, we can reasonably assume that, if recent political and economic events in a World in which the financial sector’s lobbying power seems to have been reduced, will lead to a contraction in capital flows and perhaps even repatriations. As a result, over the longer term the tables should be reversed. Those countries with net liabilities should see weaker currencies, weaker growth, weaker equity valuations and higher required real yields than the net asset countries. On this basis, one should seek to move North-eastwards in this chart.
International Investment Positions
% domestic GDP

% domestic GDP

We suspect that over the longer term, this “debtor to creditor switch” will continue to work for asset allocators if we enter a genuine repatriation world. However, in the near term, we suspect that the “gross numbers” behind these figures will also matter to currency markets.
For example, it may be the case that the gross assets of a net liabilities country, such as the USA, are in practice somewhat more liquid than its liabilities and therefore the assets of the other countries. We are only too well aware that, although much of Asia has a net foreign asset position vis-à-vis the USA, many of the US’s claims on the Asia-Pacific Region are held within easily liquidated equities, bonds and credit flows; while many of Asia’s assets in the USA are more likely tied up in less liquid property assets, private equity and other vehicles. Over the longer term, we would still expect the US to lose in a repatriation world and for the value of the USD to fall vis-à-vis the currencies surplus economies, but the ride will not be smooth as flow rates from time to time matter more than simple stocks.
Clearly, this flow rate versus stock issue makes the forecasting of near term currency moves all the harder. We know that at present US banks are actively repatriating and we hear at micro level that other institutions are doing the same.
If we are now in a world of repatriations, then we would assume that ultimately we will see currency moves favour those net asset countries at the expense of the net liabilities countries, but in the near term we can expect currencies to be volatile, difficult to predict (small managed positions seem de riguer in this environment). Consequently, we suspect that perhaps the best way to play the repatriation theme at present will be via relative asset valuations, rather than currency bets or even outright negative market bets (given that we suspect that global central banks will take it in turn to ease later this year, if only so that they can help to generate the inflation “least bad outcome” that we described in section one of this review).
Longer term, and particularly in light of this analysis, we remain firm inflationistas, even though in the near term we expect fears of slower growth to dominate bond market sentiment. There may yet come a time for a “big short” in bonds but it is not here yet; 2025 will likely see some volatility mid year but for much of the year they may well “behave” tolerably well. 2026 may however be a different matter.
Disclaimer: These views are given without responsibility on the part of the author. This communication is being made and distributed by Nikko Asset Management New Zealand Limited (Company No. 606057, FSP No. FSP22562), the investment manager of the Nikko AM NZ Investment Scheme, the Nikko AM NZ Wholesale Investment Scheme and the Nikko AM KiwiSaver Scheme. This material has been prepared without taking into account a potential investor’s objectives, financial situation or needs and is not intended to constitute financial advice and must not be relied on as such. Past performance is not a guarantee of future performance. While we believe the information contained in this presentation is correct at the date of presentation, no warranty of accuracy or reliability is given, and no responsibility is accepted for errors or omissions including where provided by a third party. This is not intended to be an offer for full details on the fund, please refer to our Product Disclosure Statement on nikkoam.co.nz.


